makeTPSo this model try to use the the take profit issue as important
the model is based on the early model that I put in last publication , the problem is that the fire point of the buy and sell has a delay and shoot some bars after (its not repaint but a bug due to TV code) . but once it stay it will calculate correctly the take profits . so I add take profit 1 and take profit 2 to the script . and since take profit 1 is correct without delay I add option to use it as buy again or short again . you can the older entry point which is H= high or L =low as your initial buy point but be aware that it sometime shoot too late since the problem in TV script to transfer the price correctly .or to enter to buy again option which is based on take profit 1 . the H and L are correctly detecting most of the time the Highs and the lows so by going on the trend them you can use the TP which are by % to max out your gains .. this is the theory behind this model
see here on amazon the concept
Buscar en scripts para "take profit"

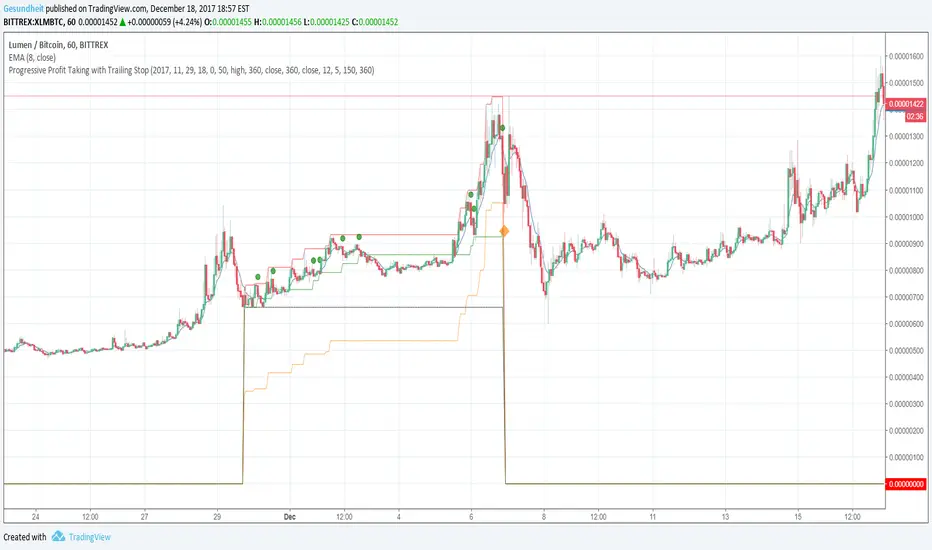
Progressive Profit Taking with Trailing StopThis is version 2 of
Special features:
Added partial profit taking as price rises. Profit taking is triggered by price crossing an EMA.
After profit taking, price has to rise by a user-specified percent before taking profits again.
Also includes condition for fully closing position after meeting specified profit target.
To incorporate into your algo, turn the plotshape functions into alertcondition.
Golden Cross, SMA 200 Moving Average Strategy (by ChartArt)This famous moving average strategy is very easy to follow to decide when to buy (go long) and when to take profit.
The strategy goes long when the faster SMA 50 (the simple moving average of the last 50 bars) crosses above the slower SMA 200. Orders are closed when the SMA 50 crosses below the SMA 200. This simple strategy does not have any other stop loss or take profit money management logic. The strategy does not short and goes long only!
Here is an article explaining the "golden cross" strategy in more detail:
www.stockopedia.com
On the S&P 500 index (symbol "SPX") this strategy worked on the daily chart 81% since price data is available since 1982. And on the DOW Jones Industrial Average (symbol "DOWI") this strategy worked on the daily chart 55% since price data is available since 1916. The low number of trades is in both cases not statistically significant though.
All trading involves high risk; past performance is not necessarily indicative of future results. Hypothetical or simulated performance results have certain inherent limitations. Unlike an actual performance record, simulated results do not represent actual trading. Also, since the trades have not actually been executed, the results may have under- or over-compensated for the impact, if any, of certain market factors, such as lack of liquidity. Simulated trading programs in general are also subject to the fact that they are designed with the benefit of hindsight. No representation is being made that any account will or is likely to achieve profits or losses similar to those shown.

Elder's Market Thermometer [LazyBear]Market temperature, introduced by Dr.Alexander Elder, helps differentiate between sleepy, quiet and hot market periods.
Following is Mr.Elder's explanation on how to use this indicator (from his book "Come in to my Trading Room"):
"When markets are quiet, the adjacent bars tend to overlap. The consensus of value is well established, and the crowd does little buying or selling outside of yesterday’s range. When highs and lows exceed their previous day’s values, they do so only by small margins. Market Thermometer falls and its EMA slants down, indicating a sleepy market. When a market begins to run, either up or down, its daily bars start pushing outside of the previous ranges. The histogram of Market Thermometer grows taller and crosses above its EMA, which soon turns up, confirming the new trend."
"Market Thermometer gives four trading signals, based on the relationship between its histogram and its moving average:
1) The best time to enter new positions is when Market Thermometer falls below its moving average. When Market Thermometer falls below its EMA, it indicates that the market is quiet. If your system flashes an entry signal, try to enter when the market is cooler than usual. When Market Thermometer rises above its moving average, it warns that the market is hot and slippage more likely.
2) Exit positions when Market Thermometer rises to triple the height of its moving average. A spike of Market Thermometer indicates a runaway move. When the crowd feels jarred by a sudden piece of news and surges, it is a good time to take profits. Panics tend to be short-lived, offering a brief opportunity to cash in. If the EMA of Market Thermometer stands at 5 cents, but the Thermometer itself shoots up to 15 cents, take profits. Test these values for the market you are trading.
3) Get ready for an explosive move if the Thermometer stays below its moving average for five to seven trading days. Quiet markets put amateurs to sleep. They become careless and stop watching prices. Volatility and volume fall, and professionals get a chance to run away with the market. Explosive moves often erupt from periods of inactivity.
4) Market Thermometer can help you set a profit target for the next trading day. If you are a short-term trader and are long, add the value of today’s Thermometer EMA to yesterday’s high and place a sell order there. If you are short, subtract the value of the Thermometer’s EMA from yesterday’s low and place an order to cover at that level."
You can configure the "Explosive Move threshold" (default: 3), "Idle Market Threshold" (default: 7) and "Thermometer EMA length" (default: 22) via Options page.
More info:
"Come in to my Trading Room - A complete Guide to Trading" by Dr.Alexander Elder. (Page 162)
List of my other indicators:
- Chart:
- GDoc: docs.google.com

1.1 SMF LONG: Sweep → BOS → OB → BOS break SMF LONG Strategy (Sweep → BOS → Order Block → BOS) — Summary
The strategy looks for a moment when the market takes liquidity to the downside through a sweep (breaking previous lows), followed by the formation of the first BOS, indicating that sellers have lost control. After that, the strategy waits for the creation of an Order Block (OB) — the last bearish candle before the upward impulse — which highlights the zone where large players entered positions. When price returns to the OB, the entry (TVH) is placed at the top of the OB, the stop-loss at the bottom of the OB, and the take-profit is always set to 3× the stop size, regardless of the OB width.
In a one-year backtest from December 2024 to December 2025, the strategy and indicator showed a win rate of 30.85%:
65 stop-losses,
29 take-profits,
and 15 missed trades where the take-profit was hit before price could return to the entry zone.

The Alchemist's Trend [wjdtks255]📊 The Alchemist's Trend - Filtered Trading Guide
This indicator, named The Alchemist's Trend, is a High-Confidence Trend-Following Strategy designed to maximize reliability. It generates a final entry signal only when the QQE (Quantitative Qualitative Estimation) momentum signal is validated by four robust filters: Long-Term Trend (MA200), Mid-Term Trend (HMA), Momentum Strength (CCI), and Higher Timeframe (HTF) Trend.
1. Indicator Mechanism and Core Components
A. Chart Visualization and Trend Identification
Trend Line (HMA): Appears as a Yellow or Purple Thick Line. It represents the direction of the current short/mid-term market trend. Candle colors follow this line.
MA 200: Appears as a Dotted Line (color configurable in settings). It is the Long-Term Trend Line. Price above it suggests a long-term bullish view; below it, a long-term bearish view.
Candle Background: Appears as Light Yellow or Purple. It matches the Trend Line direction, providing a visual cue of the trend's strength.
B. The Four-Filter System
For a confirmed entry signal ('L' or 'S') to fire, the following four conditions must all align in the same direction:
QQE (Momentum Base): Generates the primary Long/Short crossover signal.
MA & HMA (Trend Alignment):
For Long Entries: Price must be above both the MA200 and the HMA Trend Line.
For Short Entries: Price must be below both the MA200 and the HMA Trend Line.
CCI (Momentum Strengthening):
For Long Entries: CCI value must be above +50. (Confirms strong buying momentum)
For Short Entries: CCI value must be below -50. (Confirms strong selling momentum)
HTF (Higher Timeframe Trend): Checks if the price on the set higher timeframe (default 4H) is above its own Trend Line, confirming alignment with the broader market direction.
2. Trading Strategy and Usage Rules
This indicator aims to maximize signal reliability over frequency.
🔔 Entry Rule
Enter a trade only when the 'L' or 'S' label appears on the chart AND the Action panel on the dashboard displays LONG SIGNAL or SHORT SIGNAL.
Long Entry (L):
Condition: 'L' label appears (All Long conditions met).
Verification: Confirm the Trend Line and candle color are in the yellow range.
Short Entry (S):
Condition: 'S' label appears (All Short conditions met).
Verification: Confirm the Trend Line and candle color are in the purple range.
🛡️ Risk and Position Management
Stop-Loss (SL): A common practice is to place the Stop-Loss below the low of the signal candle (for Long) or above the high of the signal candle (for Short), or beyond a recent significant support/resistance level.
Exit Strategy (Three Options):
Opposite Signal: Close the position immediately if the opposite signal ('S' during a Long, or 'L' during a Short) occurs.
RSI Extremes: Consider taking partial profits if the RSI reaches 70 (for Long) or 30 (for Short), indicating potential exhaustion.
Trend Line Crossover: Exit the position if the price breaks or crosses the Trend Line, causing the candle color to change.
🖥️ Dashboard Utilization Tips
The dashboard provides contextual information to validate the signal:
RSI: Signals occurring within the neutral 30-70 zone suggest a stronger developing trend. If near 70/30, consider the risk of reversal.
Vol Status ('High'): If the volume status is 'High' when the signal fires, the signal's power is likely high, indicating a higher probability of significant movement.
Day High/Low: Use these values as a secondary reference for setting initial Stop-Loss or Take-Profit targets.

NexusNexus is a swing trading indicator designed specifically for the 4-Hour and Daily timeframes.
Unlike standard indicators that react to every minor candle flicker, Nexus uses a "Macro" approach to filter out market noise and identify significant structural pivots.
It combines three distinct mathematical engines into one consensus signal:
The Anchor (Trend): A Rational Quadratic Kernel (Length 50) + Gann High/Low Activator (Length 20). This defines the heavy, long-term flow of the market.
The Guard (Risk): A modified UT Bot (ATR Trailing Stop). This manages volatility and provides your Stop Loss levels.
The Map (Structure): Smart Money Concepts (SMC) engine that detects Major Pivots, Fair Value Gaps (FVG), Break of Structure (BOS), and Change of Character (CHoCH).
Visual Legend
Dark Green/Red Line (The Baseline): This is the Kernel Regression line. It represents the "floor" or "ceiling" of the macro trend. If price is above this, the bias is Long. If below, the bias is Short.
Neon Green/Red Line (The Risk Line): This is your Trailing Stop. It moves tighter to price as the trend matures.
Large Triangles (or Custom Shape): These are your Entry Signals. They only appear when the Trend, Risk, and Momentum engines all align perfectly.
Small Circles (BOS): "Break of Structure." These appear when price breaks a high in an uptrend (or low in a downtrend). It means the trend is healthy and continuing.
Small Diamonds (CHoCH): "Change of Character." These appear when price breaks a significant structural level against the current trend. This is an early warning sign that a reversal might be coming.
Colored Boxes (FVG): Fair Value Gaps. These are magnetic zones where price often returns to "rebalance" before continuing.
How to Trade with Nexus
Recommended Timeframes: 4 Hour (4H) or Daily (1D).
1. The Entry
Wait for a Neon Buy/Sell Signal (Default: Triangle).
Check the Dashboard: Ensure the "ACTION" cell is colored (Green for Buy, Red for Sell) and matches your signal.
Strict Alternation: The script prevents "signal spam." Once a Buy signal fires, you will not see another Buy signal until the trend flips and produces a Sell signal.
2. Stop Loss Placement
Initial Stop: Place your Stop Loss slightly beyond the Neon Risk Line at the time of entry.
Trailing: As the trade progresses, move your Stop Loss along the Neon Line. If the candle closes on the wrong side of this line, the trade is invalid.
3. Take Profit & Exits
Target 1: The next opposing FVG Box (Support/Resistance magnet).
Target 2: A CHoCH Diamond appearing against your trade. This indicates the market structure has shifted, and you should consider locking in profits.
4. Filtering Chop
If the Baseline is flat and price is weaving through it, stay out.
The "Rec. TF" on the dashboard reminds you to stick to higher timeframes where these signals are most accurate.
Disclaimer
Trading financial assets involves a high level of risk and may not be suitable for all investors. The content provided here and the "Nexus" indicator are for educational and informational purposes only and do not constitute financial, investment, or trading advice. Past performance is not indicative of future results. You are solely responsible for your own trading decisions and should always practice risk management.

YM Ultimate SNIPER# YM Ultimate SNIPER - Documentation & Trading Guide
## 🎯 Unified GRA + DeepFlow | YM-Optimized for Low Volatility
**TARGET: 3-7 High-Confluence Trades per Day**
> **Philosophy:** *YM's lower volatility is not a weakness—it's our edge. Predictability + precision = consistent profits.*
---
## ⚡ QUICK REFERENCE CARD
```
┌─────────────────────────────────────────────────────────────────────────────┐
│ YM ULTIMATE SNIPER - QUICK REFERENCE │
├─────────────────────────────────────────────────────────────────────────────┤
│ │
│ 💰 YM BASICS: │
│ ═════════════ │
│ • 1 tick = 1 point = $5/contract │
│ • Typical daily range: 150-400 points │
│ • 30-40% less volatile than NQ │
│ • More institutional, less retail noise │
│ │
├─────────────────────────────────────────────────────────────────────────────┤
│ │
│ 🎯 TIER THRESHOLDS (YM-OPTIMIZED): │
│ ══════════════════════════════════ │
│ S-TIER: 50+ pts = $250+/contract → HOLD (Institutional sweep) │
│ A-TIER: 25-49 pts = $125-245/contract → SWING (Strong momentum) │
│ B-TIER: 12-24 pts = $60-120/contract → SCALP (Quick grab) │
│ │
├─────────────────────────────────────────────────────────────────────────────┤
│ │
│ ⏰ SESSION WINDOWS: │
│ ═══════════════════ │
│ LDN → 3:00-5:00 AM ET (European flow) │
│ NY → 9:30-11:30 AM ET (US opening drive) │
│ PWR → 3:00-4:00 PM ET (End-of-day rebalancing) │
│ │
│ Expected Trades: 1-2 LDN | 2-3 NY | 1-2 PWR = 4-7 total │
│ │
├─────────────────────────────────────────────────────────────────────────────┤
│ │
│ 📊 CONFLUENCE SCORING (MAX 10 POINTS): │
│ ═══════════════════════════════════════ │
│ Tier Signal: S=3, A=2, B=1 points │
│ In Active Zone: +2 points │
│ POC Aligned: +1 point (POC at body extreme) │
│ Imbalance Support:+1 point (supporting IMB nearby) │
│ Strong Volume: +1 point (2x+ average) │
│ Strong Delta: +1 point (70%+ dominance) │
│ CVD Momentum: +1 point (CVD trending with signal) │
│ │
│ MINIMUM SCORE: 5/10 to show signal (adjustable) │
│ IDEAL SCORE: 7+/10 for highest probability │
│ │
├─────────────────────────────────────────────────────────────────────────────┤
│ │
│ 🚨 SIGNAL TYPES: │
│ ═════════════════ │
│ S🎯 / A🎯 / B🎯 → GRA Tier Signals (Full confluence) │
│ Z🎯 → Zone Entry (At DFZ zone + delta + volume) │
│ SP → Single Print (Institutional impulse) │
│ │
├─────────────────────────────────────────────────────────────────────────────┤
│ │
│ ✓ ENTRY CHECKLIST: │
│ ═══════════════════ │
│ □ Signal appears (check Score ≥5) │
│ □ Session active (LDN!/NY!/PWR!) │
│ □ Table: Vol GREEN, Delta colored, Body GREEN │
│ □ CVD arrow (▲/▼) matches direction │
│ □ Note stop/target lines on chart │
│ □ Check Zone status (bonus if IN ZONE) │
│ □ Execute at signal candle close │
│ │
├─────────────────────────────────────────────────────────────────────────────┤
│ │
│ 🎯 POSITION SIZING BY TIER: │
│ ═══════════════════════════ │
│ S-TIER (50+ pts): Full size, hold 2-5 min, target 2.5:1 R:R │
│ A-TIER (25-49): 75% size, hold 1-3 min, target 2.0:1 R:R │
│ B-TIER (12-24): 50% size, hold 30-90 sec, target 1.5:1 R:R │
│ │
├─────────────────────────────────────────────────────────────────────────────┤
│ │
│ ⛔ DO NOT TRADE WHEN: │
│ ════════════════════ │
│ ✗ Session shows "---" │
│ ✗ Score < 5/10 │
│ ✗ Vol shows RED (<1.8x) │
│ ✗ Delta < 62% │
│ ✗ Multiple conflicting signals │
│ ✗ Just before major news (FOMC, NFP, etc.) │
│ │
└─────────────────────────────────────────────────────────────────────────────┘
```
---
## 📋 WHY YM? LEVERAGING LOW VOLATILITY
### The YM Advantage
Most traders avoid YM because "it doesn't move enough." This is precisely why it's perfect for precision scalping:
| Factor | NQ | YM | Advantage |
|--------|----|----|-----------|
| **Daily Range** | 300-600 pts | 150-400 pts | More predictable moves |
| **Tick Value** | $5/tick (4 ticks/pt) | $5/tick (1 tick/pt) | Simpler math |
| **Retail Noise** | High | Low | Cleaner signals |
| **Whipsaws** | Frequent | Rare | Fewer fakeouts |
| **Trend Persistence** | Short | Long | Easier holds |
| **Fill Quality** | Variable | Consistent | Better execution |
### Why 3-7 Trades is the Sweet Spot
```
YM SESSION BREAKDOWN:
════════════════════
LONDON (3-5 AM ET): 1-2 trades
├── Why: European institutions positioning for US open
├── Character: Slow build-up, clean trends
└── Best signals: Zone entries + A/B tier
NY OPEN (9:30-11:30 AM ET): 2-3 trades
├── Why: Highest volume, most institutional activity
├── Character: Initial balance formation, breakouts
└── Best signals: S/A tier, zone confluence
POWER HOUR (3-4 PM ET): 1-2 trades
├── Why: End-of-day rebalancing, MOC orders
├── Character: Mean reversion or trend acceleration
└── Best signals: Zone entries, B tier quick scalps
TOTAL: 4-7 high-quality setups per day
```
---
## 🔧 YM-SPECIFIC OPTIMIZATIONS
This unified indicator has been specifically tuned for YM's characteristics:
### Tier Thresholds
| Tier | NQ (Original) | YM (Optimized) | Rationale |
|------|---------------|----------------|-----------|
| S-Tier | 100 pts | **50 pts** | YM's daily range is ~50% of NQ |
| A-Tier | 50 pts | **25 pts** | Proportional scaling |
| B-Tier | 20 pts | **12 pts** | Still 5%+ of typical daily range |
### Filter Adjustments
| Filter | NQ Value | YM Value | Why |
|--------|----------|----------|-----|
| Volume Ratio | 1.5x | **1.8x** | Higher bar = less retail noise |
| Delta Threshold | 60% | **62%** | Tighter for cleaner signals |
| Body Ratio | 70% | **72%** | More conviction required |
| Range Multiplier | 1.3x | **1.4x** | Bigger move = real signal |
| Gap ATR% | 30% | **25%** | Smaller gaps still significant |
| Zone Age | 50 bars | **75 bars** | Zones last longer in slow market |
### Why These Changes Work
1. **Higher Volume Bar**: YM has more institutional flow. Requiring 1.8x volume ensures we're catching real moves, not retail chop.
2. **Tighter Delta**: With less noise, we can demand clearer buyer/seller dominance before entering.
3. **Longer Zone Life**: YM trends persist longer. A zone that would be stale in NQ is still viable in YM.
4. **Smaller Gap Threshold**: YM gaps are naturally smaller. 25% of ATR in YM is significant institutional activity.
---
## 📊 CONFLUENCE SCORING SYSTEM
The unified indicator uses a 10-point confluence scoring system to filter for only the highest-probability setups:
### Score Breakdown
```
CONFLUENCE SCORE CALCULATION:
═════════════════════════════
BASE POINTS (Tier):
├── S-Tier signal: +3 points
├── A-Tier signal: +2 points
└── B-Tier signal: +1 point
BONUS POINTS:
├── Inside Active Zone (DFZ): +2 points
│ └── Price within bull/bear zone = institutional level
│
├── POC Alignment: +1 point
│ └── POC at body extreme = strong conviction
│
├── Imbalance Support: +1 point
│ └── Supporting imbalance within 1 ATR
│
├── Strong Volume (2x+): +1 point
│ └── Exceptional institutional participation
│
├── Strong Delta (70%+): +1 point
│ └── Clear one-sided aggression
│
└── CVD Momentum: +1 point
└── CVD trending with signal direction
MAXIMUM POSSIBLE: 10 points
```
### Score Interpretation
| Score | Quality | Action | Expected Win Rate |
|-------|---------|--------|-------------------|
| 8-10 | 🥇 Elite | Full size, hold for target | 75-80% |
| 6-7 | 🥈 Strong | Standard size, manage actively | 65-70% |
| 5 | 🥉 Valid | Reduced size, quick scalp | 55-60% |
| <5 | ⚫ Filtered | No signal shown | N/A |
### Adjusting Minimum Score
- **Conservative (Score ≥6)**: Fewer trades, higher win rate
- **Standard (Score ≥5)**: Balanced approach, 3-7 trades/day
- **Aggressive (Score ≥4)**: More trades, requires active management
---
## 📐 SIGNAL TYPES EXPLAINED
### 1. GRA Tier Signals (S🎯, A🎯, B🎯)
These are the primary signals from the merged GRA system:
```
TIER SIGNAL REQUIREMENTS:
═══════════════════════════
ALL must be TRUE:
├── ✓ Point movement meets tier threshold
├── ✓ Volume ≥ 1.8x average
├── ✓ Delta ≥ 62% (buy or sell dominance)
├── ✓ Body ≥ 72% of candle range
├── ✓ Range ≥ 1.4x average
├── ✓ Small opposite wick (<50% of body)
├── ✓ CVD confirms direction (if enabled)
├── ✓ Active session (LDN/NY/PWR)
└── ✓ Confluence Score ≥ minimum (default 5)
```
### 2. Zone Entry Signals (Z🎯)
When price enters a DeepFlow zone with confirmation:
```
ZONE ENTRY REQUIREMENTS:
═══════════════════════════
ALL must be TRUE:
├── ✓ Price inside fresh/tested zone (not broken)
├── ✓ Delta ≥ 62% in zone direction
├── ✓ Volume ≥ 1.5x average
└── ✓ Active session
NOTE: Z🎯 only appears when NOT already showing tier signal
(prevents duplicate signals on same candle)
```
### 3. Single Print Markers (SP)
Mark institutional impulse candles for future S/R:
```
SINGLE PRINT REQUIREMENTS:
═══════════════════════════
ALL must be TRUE:
├── ✓ Range ≥ 1.6x average
├── ✓ Body ≥ 72% of range
├── ✓ Volume ≥ 1.8x average
├── ✓ Delta ≥ 62% confirms direction
└── ✓ Active session
USE: Horizontal lines at high/low act as future S/R
```
---
## 🎯 TRADING STRATEGIES
### Strategy 1: Zone + Tier Confluence (Highest Probability)
```
THE ULTIMATE YM SETUP:
═══════════════════════
Setup:
1. Active DeepFlow zone exists (green box below for long)
2. Price pulls back INTO the zone
3. Tier signal fires INSIDE the zone (S🎯/A🎯)
4. Score shows 7+/10
Entry: Signal candle close
Stop: Below zone bottom (for longs)
Target: Based on tier (1.5-2.5:1 R:R)
Why It Works:
• Zone = institutional limit orders
• Tier signal = momentum confirmation
• Double confirmation = high probability
Expected Win Rate: 70-75%
```
### Strategy 2: Pure Tier Signal with POC Stop
```
SNIPER TIER TRADE:
══════════════════
Setup:
1. Tier signal appears (preferably A or S)
2. Score ≥ 5/10
3. Note POC level on signal candle
4. Red/green stop/target lines appear
Entry: Signal candle close
Stop: Beyond POC (shown on chart)
Target: Auto-calculated based on tier
Key: POC placement matters
• POC near candle bottom (longs) = STRONG
• POC in middle = weaker signal
• POC at extreme = possible exhaustion
Expected Win Rate: 60-65%
```
### Strategy 3: Zone Bounce (Continuation)
```
ZONE BOUNCE TRADE:
══════════════════
Setup:
1. Fresh zone created during session
2. Price leaves zone, moves in zone direction
3. Price returns to test zone (within 15 bars)
4. Z🎯 signal appears or rejection candle forms
Entry: At CE line (middle of zone)
Stop: Beyond zone edge
Target: Previous swing high/low
Why It Works:
• Zones represent unfilled orders
• First retest often finds support/resistance
• Lower volatility = cleaner bounces
Expected Win Rate: 55-60%
```
### Strategy 4: Single Print Scalp
```
SINGLE PRINT SCALP:
═══════════════════
Setup:
1. Single Print (SP) marker appears
2. Note the gold/purple lines at high/low
3. Wait for price to return to SP level
4. Look for rejection or tier signal at level
Entry: At SP line with confirmation
Stop: Beyond the SP line
Target: Quick 1:1 or to next structure
Why It Works:
• SP = price moved too fast, orders unfilled
• Price often returns to "fill" these levels
• YM's slower pace makes retests likely
Expected Win Rate: 55-60%
```
---
## 📊 TABLE LEGEND
| Field | Reading | Color Meaning |
|-------|---------|---------------|
| **Pts** | Current candle points | Gold/Green/Yellow = Tiered |
| **Tier** | S/A/B/X | Tier color or white |
| **Vol** | Volume ratio | 🟢 ≥1.8x, 🔴 <1.8x |
| **Delta** | Buy/Sell % | 🟢 Buy dom, 🔴 Sell dom |
| **Body** | Body % of range | 🟢 ≥72%, 🔴 <72% |
| **CVD** | Trend direction | ▲ Bullish, ▼ Bearish |
| **Sess** | Active session | 🟡 LDN!/NY!/PWR!, ⚫ --- |
| **POC** | Point of Control | 🟡 Gold price level |
| **Zone** | Zone position | 🟢 BUY⬚, 🔴 SELL⬚, ⚫ --- |
| **Zones** | Active zone count | #B/#S format |
| **Score** | Confluence score | 🟢 7+, 🟡 5-6, ⚫ <5 |
| **IMB** | Recent imbalances | Count in last 10 bars |
| **R:R** | Risk/Reward | 🟢 On signal, ⚫ No signal |
---
## ⏰ SESSION-SPECIFIC PLAYBOOKS
### London Session (3:00-5:00 AM ET)
```
CHARACTER: Slow, methodical, trend-building
VOLUME: Medium (50-70% of NY)
BEST SETUPS: Zone entries, A/B tier with zones
PLAYBOOK:
• Enter on zone retests
• Expect 15-25 pt moves
• Don't fight early direction
• Watch for pre-NY positioning
TYPICAL TRADES: 1-2
```
### NY Open (9:30-11:30 AM ET)
```
CHARACTER: Fast, volatile, high-conviction
VOLUME: Highest of day
BEST SETUPS: S/A tier, zone confluence
PLAYBOOK:
• First 15 min: Observe Initial Balance
• 9:45-10:15: Best setups form
• S-tier signals = ride the wave
• Be aggressive on high scores
TYPICAL TRADES: 2-3
```
### Power Hour (3:00-4:00 PM ET)
```
CHARACTER: Rebalancing, MOC orders
VOLUME: Medium-high (70-80% of NY)
BEST SETUPS: B tier scalps, zone entries
PLAYBOOK:
• Watch for mean reversion setups
• Quick scalps around POC levels
• Don't hold through close
• Take profits at 1:1 R:R
TYPICAL TRADES: 1-2
```
---
## 🔧 RECOMMENDED SETTINGS
### Conservative (Fewer, Better Trades)
| Setting | Value | Notes |
|---------|-------|-------|
| Min Confluence Score | 6 | Only strong setups |
| Min Volume Ratio | 2.0 | Higher bar |
| Delta Threshold | 65% | Stricter dominance |
| Max Zones | 8 | Less clutter |
### Standard (Balanced)
| Setting | Value | Notes |
|---------|-------|-------|
| Min Confluence Score | 5 | Default |
| Min Volume Ratio | 1.8 | Default |
| Delta Threshold | 62% | Default |
| Max Zones | 12 | Default |
### Aggressive (More Opportunities)
| Setting | Value | Notes |
|---------|-------|-------|
| Min Confluence Score | 4 | More signals |
| Min Volume Ratio | 1.5 | Lower bar |
| Delta Threshold | 60% | Looser |
| Max Zones | 15 | More context |
---
## 🚨 ALERT SETUP
Configure these alerts in TradingView:
| Alert | Priority | Action |
|-------|----------|--------|
| 🎯 YM S-TIER LONG/SHORT | 🔴 CRITICAL | Drop everything, check immediately |
| 🎯 YM A-TIER LONG/SHORT | 🟠 HIGH | Evaluate within 15 seconds |
| 🎯 YM B-TIER LONG/SHORT | 🟡 MEDIUM | Check if available |
| 🎯 YM ZONE BUY/SELL | 🟢 STANDARD | Good context entry |
| 📦 NEW ZONE | 🔵 INFO | Mark on mental map |
| ⭐ SINGLE PRINT | 🔵 INFO | Note for future S/R |
| SESSION OPEN | ⚪ INFO | Prepare to trade |
### Alert Message Format
```
🎯 YM A-LONG | YM1! @ 42,150 | 68%B | Score: 7/10 | IN ZONE | POC: 42,125 | Stop: 42,098 | SWING
```
---
## ⚠️ COMMON MISTAKES TO AVOID
| Mistake | Why It's Bad | Solution |
|---------|-------------|----------|
| Trading outside sessions | Low volume = noise | Wait for LDN/NY/PWR |
| Ignoring score | Low scores = low probability | Require ≥5/10 |
| Fighting the zone | Zones are institutional | Trade WITH zones |
| Oversizing B-tier | Quick scalps, not holds | 50% size max |
| Holding through news | Volatility spike | Exit before FOMC, NFP |
| Chasing after signal | Entry on close only | Miss it = wait for next |
| Ignoring POC position | Middle POC = indecision | Strong = extreme POC |
---
## 📈 DAILY TRADE JOURNAL TEMPLATE
```
DATE: ___________
SESSION: □ LDN □ NY □ PWR
TRADE 1:
├── Time: _______
├── Signal: S🎯 / A🎯 / B🎯 / Z🎯
├── Score: ___/10
├── Entry: _______
├── Stop: _______
├── Target: _______
├── In Zone: □ Yes □ No
├── Result: +/- ___ pts ($_____)
└── Notes: _______________________
TRADE 2:
DAILY SUMMARY:
├── Total Trades: ___
├── Win Rate: ___%
├── Net P/L: $_____
├── Best Setup: _______
└── Improvement: _______________________
```
---
## 🏆 GOLDEN RULES FOR YM
> **"YM rewards patience. Wait for the confluence—it's worth it."**
> **"Low volatility means you can size up. One good trade beats five forced trades."**
> **"Score 7+ is your edge. Anything less is gambling."**
> **"The zone + tier combo is your bread and butter. Master it."**
> **"Leave every trade with money. YM gives you time to manage."**
---
## 📊 VISUAL GUIDE
```
PERFECT YM SNIPER SETUP:
═══════════════════════════════════════════════════════════════════
│ Current Price
│
┌─────────────────────────┴────────────────────────────┐
│ BEARISH ZONE (Red) │
│- - - - - - - CE Line (Entry for shorts) - - - - - - │
│ │
└──────────────────────────────────────────────────────┘
│
══════════════════╪══════════════════ SP High (Purple)
│
┌─────────────────────┤
│█████████████████████│ ← A🎯 LONG Signal
│█████████████████████│ Score: 8/10
│ ●──────────────────│ ← POC (Gold) near bottom = STRONG
│█████████████████████│
│█████████████████████│
└─────────────────────┤
│
══════════════════╪══════════════════ SP Low (Purple)
│
┌─────────────────────────┴────────────────────────────┐
│ BULLISH ZONE (Green) │
│- - - - - - - CE Line (Entry for longs) - - - - - - -│
│██████████████████████████████████████████████████████│
└──────────────────────────────────────────────────────┘
│
Stop Loss
CONFLUENCE CHECK:
✓ A-Tier signal (+2)
✓ At edge of bullish zone (+2)
✓ POC at bottom of candle (+1)
✓ Strong volume 2.3x (+1)
✓ Delta 72% buyers (+1)
✓ CVD bullish (+1)
TOTAL: 8/10 = ELITE SETUP
ACTION: Full size LONG at signal candle close
STOP: Below zone bottom
TARGET: 2:1 R:R (auto-calculated)
```
---
## 🔧 TROUBLESHOOTING
| Issue | Cause | Fix |
|-------|-------|-----|
| No signals appearing | Score too high | Lower min score to 4-5 |
| Too many signals | Score too low | Raise min score to 6+ |
| Zones cluttering chart | Max zones high | Reduce to 8-10 |
| POC not showing | Tiered filter on | Check "POC Only Tiered" |
| Session not highlighting | Wrong timezone | Verify timezone setting |
| Alerts not firing | Not configured | Set up in TradingView alerts |
---
## 📝 PINE SCRIPT V6 TECHNICAL NOTES
This indicator uses advanced features:
- **User Defined Types (UDT)**: Clean state management for zones/imbalances
- **`request.security_lower_tf()`**: Intrabar volume analysis
- **Dynamic Array Management**: Efficient memory for drawings
- **Confluence Scoring Engine**: Multi-factor signal qualification
- **Auto Stop/Target**: Dynamic risk management calculation
**Minimum TradingView Plan:** Pro (for intrabar data access)
---
*© Alexandro Disla - YM Ultimate SNIPER*
*Pine Script v6 | TradingView*
*Unified GRA v5 + DeepFlow Zones | YM-Optimized*

FPT - DCA ModelFPT - DCA Model is a simple but powerful tool to backtest a weekly “buy the dip” DCA plan with dynamic position sizing and partial profit-taking.
🔹 Core Idea
- Invest a fixed amount every week (on Friday closes)
- Buy more aggressively when price trades at a discount from its 52-week high
- Take partial profits when price stretches too far above the daily EMA50
- Track the performance of your DCA plan vs a simple buy-and-hold from the same start date
⚙ How it works
1. Weekly DCA (on Daily timeframe)
- On each Friday after the Start Date:
- Add the “Weekly contribution” to the cash pool.
- If the close is below the “Discount from 52W high” level:
→ FULL DCA: use the full weekly contribution + an extra booster from your stash (up to “Max extra stash used on dip”).
→ Marked on the chart with a small green triangle under the bar.
- Otherwise:
→ HALF DCA: invest only 50% of the weekly contribution and keep the other 50% as stash (uninvested cash).
→ Marked with a small blue triangle under the bar.
2. 52-Week High Discount Logic
- The script computes the 52-week high as the highest daily high of the last 252 trading days.
- The “discount level” is: 52W high × (1 – Discount%).
- When price is at or below this level, dips are treated as buying opportunities and the model allocates more.
3. Selling Logic (Partial Take Profit)
- When the close is above the daily EMA50 by the selected percentage:
→ Sell the given “Sell portion of qty (%)” of your current holdings.
→ Marked with a small red triangle above the bar.
- This behaves like a gradual profit-taking system: if price stays extended above EMA50, multiple partial sells can occur over time.
📊 Panel (top-right)
The panel summarizes the state of your DCA plan:
- Weeks: number of DCA weeks since Start Date
- Total deposit: total money contributed (sum of all weekly contributions)
- Shares qty: total number of shares accumulated
- Avg price: volume-weighted average entry price
- Shares value: current market value of all shares (qty × close)
- Cash: uninvested cash (including saved stash)
- Total equity: Shares value + Cash
- DCA % PnL: performance of the DCA plan vs total deposits
- Stock % since start: performance of the underlying asset since the Start Date
✅ Recommended Use
- Timeframe: Daily (the DCA engine is designed to run on daily bars and Friday closes).
- Works best on stocks, ETFs or indices where a 52-week high is a meaningful reference.
- You can tune:
- Weekly contribution
- Discount from 52W high
- Booster amount
- EMA50 extension threshold and sell portion
⚠ Notes & Disclaimer
- This script is a backtesting and educational tool. It does not place real orders.
- Past performance does not guarantee future results.
- Always combine DCA and risk management with your own research and judgment.
Built by FPT (Funded Pips Trading) for long-term, rules-based DCA planning.

Mean Reversion — BB + Z-Score + RSI + EMA200 (TP at Opposite Z)This is a systematic mean-reversion framework for index futures and other liquid assets.
This strategy combines Bollinger Bands, Z-Score dislocation, RSI extremes, and a trend-filtering EMA200 to capture short-term mean-reversion inefficiencies in NQ1!. It is designed for high-volatility conditions and uses a precise exit model based on opposite-side Z-Score targets and dynamic mid-band failure detection.
🔍 Entry Logic (Mean Reversion) :
The strategy enters trades only when multiple confluence signals align:
Long Setup
Price at or below the lower Bollinger Band
Z-Score ≤ –Threshold (deep statistical deviation)
RSI ≤ oversold level
Price below the EMA-200 (countertrend mean-reversion only)
Cooldown must be completed
No open position
Short Setup
Price at or above the upper Bollinger Band
Z-Score ≥ Threshold
RSI ≥ overbought level
Price above the EMA-200
Cooldown complete
No open position
This multi-signal gate filters out weak reversions and focuses on mature dislocations.
🎯 Take-Profit Model: Opposite-Side Z-Score Target :
Once in a trade, take-profit is set by solving for the price where the Z-Score reaches the opposite side:
Long TP = Z = +Threshold
Short TP = Z = –Threshold
This creates a symmetric statistical exit based on reverting to equilibrium plus overshoot.
🛡️ Stop-Loss System (Volatility-Aware) :
Stop losses combine:
A fixed base stop (points)
A standard-deviation volatility component
This adapts the SL to regime changes and avoids being shaken out during rare volatility spikes.
⏳ Half-Life Exit :
If a trade has not reverted within a fixed number of bars, it automatically closes.
This prevents “mean-reversion traps” during trending periods.
📉 Advanced Mid-Band Exit Logic (BB Basis Failure) :
This is the unique feature of the system.
After entry:
Wait for price to cross the Bollinger Basis (middle band) in the direction of the mean.
Start a 5-bar delay timer.
After 5 bars, the strategy becomes “armed.”
Once armed:
If price fails back through the mean, exit immediately.
Intrabar exits trigger precisely (with tick-level precision if Bar Magnifier is enabled).
This protects profits and exits trades at the first sign of mean-failure.
⏱️ Cooldown System :
After each closed trade, a cooldown period prevents immediate re-entry.
This avoids clustering and improves statistical independence of trades.
🖥️ What This Strategy Is Best For :
High-volatility intraday NQ conditions
Statistical mean reversion with structured confluence
Traders who want clean, rule-based entries
Avoiding trend-day traps using EMA and half-life logic
📊 Included Visual Elements :
Bollinger Bands (Upper, Basis, Lower)
BUY/SELL markers at signal generation
Optional alerts for automated monitoring
🚀 Summary :
This is a precision mean-reversion system built around volatility bands, statistical dislocation, and price-behavior confirmation. By combining Z-Score, RSI, EMA200 filtering, and a sophisticated mid-band failure exit, this model captures high-probability reversions while avoiding the common pitfalls of naive band-touch systems.

MTF Trading Helper & Multi AlertsHi dear fellows, I´m using this indicator for my trading, so every then and when I will publish updates on this one.
This indicator should help to identify the right trading setup. I´m using it to trade index futures and stocks.
MTF Trading Helper & Multi Alerts
Overview
This indicator provides a clear visual representation of trend direction across three timeframes. It helps traders identify trend alignment, potential reversals, and optimal entry/exit points by analyzing the relationship between different smoothed timeframes.
You can set up multiple alerts (as one alert in Tradingview)
How It Works
The indicator displays three colored circles representing the smoothed candle direction on three different timeframes:
Bottom plot represents the overall trend direction, the plot in the middle shows intermediate momentum, and the one on top captures short-term price action.
When a color change occurs, the circle appears in a darker shade to highlight the transition.
🟢 Green = Bullish - 🔴 Red = Bearish
This change can also trigger multiple alerts.
Timeframe Settings - important
Choose between two trading setups, either for:
Intraday 1-minute candles or 1h for swing trading. Set up your chart accordingly to that timeframe.
Intraday | 1Min chart candles
Swing | 1 hour chart candles
Plots
TF3 represents the overall trend direction (bottom), TF2 shows intermediate momentum (middle), and TF1 captures short-term price action (top).
Interpretation & Strategy Alerts
1. Trend Bullish (TF3 turns Green)
The higher timeframe has shifted bullish - a potential new uptrend is forming.
Example: You're watching ES-mini on the Intraday setting. TF3 turns green after being red for several days. This signals the broader trend may be shifting bullish - consider looking for long opportunities.
2. Trend Bearish (TF3 turns Red)
The higher timeframe has shifted bearish - consider protecting profits or exiting long positions.
Example: You hold a long position in Es-mini. TF3 turns red, indicating the macro trend is weakening. This is your signal to take profits or tighten stop-losses.
3. Possible Accumulation (TF3 Red + TF2 turns Green)
While the overall trend is still bearish, the medium timeframe shows buying pressure. Smart money may be accumulating - watch closely for a potential trend reversal.
Example: Es-mini has been in a downtrend (TF3 red). Suddenly TF2 turns green while TF3 remains red. This could indicate institutional buying before a reversal. Don't buy yet, but add it to your watchlist and wait for confirmation.
4. Trend Continuation (TF3 Green + TF2 turns Green)
The medium timeframe realigns with the bullish macro trend - a potential buying opportunity as momentum returns to the uptrend.
Example: Es-mini is in an uptrend (TF3 green). After a pullback, TF2 was red but now turns green again. The pullback appears to be over - this is a trend continuation signal and a potential entry point.
5. Buy the Dip (TF3 + TF2 Green + TF1 turns Green)
All timeframes are now aligned bullish. The short-term pullback is complete and price is resuming the uptrend - optimal entry for short-term trades.
Example: Es-mini is trending up (TF3 + TF2 green). A small dip caused TF1 to turn red briefly. When TF1 turns green again, all three timeframes are aligned - this is your "Buy the Dip" signal with strong confirmation.
6. Sell the Dip (TF3 + TF2 Green + TF1 turns Red)
Short-term weakness within an uptrend. This can be used to take partial profits, wait for a better entry, or trail stops tighter.
Example: You're long on ES-mini with TF3 and TF2 green. TF1 turns red, indicating short-term selling pressure. Consider taking partial profits here and wait for TF1 to turn green again (Buy the Dip) to add back to your position.
How to Use
Choose your scenario: Select "Intraday" 1min-chart for day trading or "Swing" 1h-chart for swingtrading
Enable alerts: Turn on the strategy alerts you want to receive in the settings
Wait for signals: Let the indicator notify you when conditions align
Confirm with price action: Always use additional confirmation before entering trades
Best Practices
✅ Use TF3 as your trend filter - only take longs when TF3 turns green and hold them :)
✅ Use TF2 for timing - wait for TF2 to align with TF3 for swings.
✅ Use TF2 for early entries (accumulation phase) when TF3 is still red. Watch out!
✅ Use TF1 for entries when TF3 and TF2 are green. Only buy if TF1 is red. Keep it short and sweet.
✅ Combine with support/resistance levels for better entries
✅ Use proper risk management - no indicator is 100% accurate
Disclaimer
This indicator is for educational purposes only. Past performance does not guarantee future results. Always do your own research and use proper risk management. Never risk more than you can afford to lose.

Apex Trend & Liquidity Master (SMC)v7.2The Apex Trend & Liquidity Master (SMC)v7.2 is a comprehensive trading system designed to solve a specific problem: how to integrate Trend Following, Classic Supply & Demand, and Smart Money Concepts (SMC) onto a single chart without creating visual chaos.
Most indicators force traders to choose between high-lag trend filters or noisy price action concepts. This script combines both into a unified workflow. It uses a sophisticated "Ghost Mode" transparency engine to keep internal market structures subtle, ensuring the trader's focus remains on price action and the dominant trend.
Core Philosophy
This tool operates on the principle of "External Trend, Internal Liquidity." It forces the trader to respect the macro direction (Trend Cloud) while using micro-structure (FVGs, Order Blocks) for precision entries.
Key Features
Trend Architecture (The Context) The foundation of the script is a dynamic Hull Moving Average (HMA) combined with ATR volatility bands. This creates a "Trend Cloud" that visualizes the dominant market state.
Teal Cloud: Bullish Context (Look for Longs).
Maroon Cloud: Bearish Context (Look for Shorts).
Classic Liquidity (The Targets) The script identifies major Swing Highs and Swing Lows based on pivot sensitivity. These are rendered as solid blocks and represent "External Liquidity." These are your primary Take Profit targets or major reversal zones.
Smart Money Concepts (The Entry) The script automatically detects internal market structure, including:
BOS (Break of Structure): Signals trend continuation.
CHoCH (Change of Character): Signals potential trend reversal.
Order Blocks & FVGs: Institutional footprints that act as magnets for price. These feature "Ghost Mode" styling (high transparency, no borders) and "Auto-Mitigation" (they are deleted immediately when price closes through them) to keep the chart clean.
Signal & Risk Engine
Entry Signals: Momentum-based Buy/Sell labels that filter out chop using ADX.
Trailing Stop: A Chandelier-style ATR trailing stop line to assist in trade management and locking in profits.
Visual Legend & Color Hierarchy
To allow for instant chart processing, the colors follow a strict hierarchy:
Context (Dark/Deep Colors): The Trend Cloud and Bar Colors use Deep Teal and Maroon. These indicate the background environment.
Action (Neon Colors): Signals, BOS/CHoCH lines, and the Trailing Stop use Neon Green and Neon Red. These require immediate attention.
Major Levels (Solid Colors): Classic Supply & Demand zones use Standard Forest Green and Brick Red. These are hard targets.
Internal Zones (Pale/Ghost Colors): Order Blocks and FVGs use Pale Mint and Pale Rose with high transparency. These are background areas of interest for entries.
How to Use This Indicator
For the highest probability setups, use a "Confluence Approach" rather than trading signals in isolation:
Identify Direction: Look at the Trend Cloud. Do not trade against the color of the cloud.
Wait for Pullback: Wait for price to retrace into a "Ghost Zone" (Fair Value Gap or Order Block) nested inside the trend.
Wait for Trigger: Look for a Neon "Buy" or "Sell" signal, or a BOS line break in the direction of the trend.
Manage Risk: Use the Trailing Stop line to manage your position.
Target Liquidity: Aim for the solid Classic Supply/Demand zones as exit points.
Settings & Customization
Trend Length: Default is 55 (Swing). Lower this to 20-30 for Scalping.
Signal Toggles: Signals and Trailing Stops are enabled by default but can be toggled off for a pure price-action view.
Sensitivity: The Pivot Lookback (Default 10) controls how many Supply/Demand zones appear.
Disclaimer
This script is for educational and informational purposes only. It does not constitute financial advice. Trading in financial markets involves a high degree of risk, and you should not trade with money you cannot afford to lose. Past performance of any trading system or methodology is not necessarily indicative of future results. Always perform your own due diligence and use proper risk management.

Viprasol Elite Flow Pro - Premium Order Flow & Trend System═══════════════════════════════════════════════════════════════
🔥 VIPRASOL ELITE FLOW PRO
Professional Order Flow & Trend Detection System
═══════════════════════════════════════════════════════════════
📊 WHAT IS THIS INDICATOR?
Viprasol Elite Flow Pro is a comprehensive trading system that combines institutional order flow analysis with adaptive trend detection. Unlike basic indicators, this tool identifies high-probability setups by analyzing where smart money is likely positioning, while filtering signals through multiple confirmation layers.
This indicator is designed for traders who want to:
✓ Identify premium (supply) and discount (demand) zones automatically
✓ Detect trend direction with adaptive cloud technology
✓ Spot high-volume rejection points before major moves
✓ Filter low-quality signals with intelligent confirmation logic
✓ Track market strength in real-time via elite dashboard
═══════════════════════════════════════════════════════════════
🎯 CORE FEATURES
═══════════════════════════════════════════════════════════════
1️⃣ ELITE TREND ENGINE
• Adaptive Moving Average system (Fast/Adaptive/Smooth modes)
• Dynamic trend cloud that expands/contracts with volatility
• Real-time trend state tracking (Bullish/Bearish/Ranging)
• Trend strength meter (0-10 scale)
• ATR-based volatility adjustments
2️⃣ ORDER FLOW DETECTION
• Automatic Premium Zone (Supply) identification
• Automatic Discount Zone (Demand) identification
• Smart zone extension - zones remain valid until broken
• Zone rejection detection with price action confirmation
• Customizable zone strength (5-30 bars lookback)
3️⃣ VOLUME INTELLIGENCE
• Volume spike detection (configurable threshold)
• Climax bar identification (exhaustion signals)
• Volume filter for signal validation
• Institutional activity detection
4️⃣ SMART SIGNAL SYSTEM
• 3 Signal Modes: Aggressive, Balanced, Conservative
• Multi-layer confirmation logic
• Automatic profit targets (2:1 risk-reward)
• Stop loss suggestions based on ATR
• Prevents overtrading with bars-since-signal filter
5️⃣ ELITE DASHBOARD (HUD)
• Real-time trend direction and strength
• Volume status monitoring
• Active zones counter
• Market volatility gauge
• Current signal status
• 4 positioning options, compact mode available
6️⃣ PREMIUM STYLING
• 4 Professional color themes (Cyber/Gold/Ocean/Fire)
• Adjustable transparency and label sizes
• Clean, institutional-grade visuals
• Optimized for all chart types
═══════════════════════════════════════════════════════════════
📖 HOW TO USE THIS INDICATOR
═══════════════════════════════════════════════════════════════
STEP 1: TREND IDENTIFICATION
→ Green Cloud = Bullish trend - look for LONG opportunities
→ Red Cloud = Bearish trend - look for SHORT opportunities
→ Purple Cloud = Ranging - wait for breakout or fade extremes
STEP 2: ZONE ANALYSIS
→ PREMIUM (Red) zones = Potential resistance/supply areas
→ DISCOUNT (Green) zones = Potential support/demand areas
→ Price rejecting from zones = high-probability setups
STEP 3: SIGNAL CONFIRMATION
→ Wait for "LONG" or "SHORT" labels to appear
→ Check dashboard for trend strength (Moderate/Strong preferred)
→ Confirm volume status is "HIGH" or "CLIMAX"
→ Entry: Enter when label appears
→ Stop Loss: Use dotted line (1 ATR away)
→ Take Profit: Use dashed line (2 ATR away)
STEP 4: RISK MANAGEMENT
→ Never risk more than 1-2% per trade
→ Use the provided stop loss levels
→ Trail stops as price moves in your favor
→ Avoid trading during low volatility periods
═══════════════════════════════════════════════════════════════
⚙️ RECOMMENDED SETTINGS
═══════════════════════════════════════════════════════════════
FOR SCALPING (1M - 5M):
- Trend Type: Fast
- Sensitivity: 15
- Signal Mode: Aggressive
- Zone Strength: 8
FOR DAY TRADING (15M - 1H):
- Trend Type: Adaptive
- Sensitivity: 21 (default)
- Signal Mode: Balanced
- Zone Strength: 12 (default)
FOR SWING TRADING (4H - Daily):
- Trend Type: Smooth
- Sensitivity: 34
- Signal Mode: Conservative
- Zone Strength: 20
BEST MARKETS:
✓ Crypto (BTC, ETH, major altcoins)
✓ Forex (Major pairs: EUR/USD, GBP/USD)
✓ Indices (S&P 500, NASDAQ, DAX)
✓ High-liquidity stocks
═══════════════════════════════════════════════════════════════
🎓 UNDERSTANDING THE METHODOLOGY
═══════════════════════════════════════════════════════════════
This indicator is built on three core concepts:
1. ORDER FLOW THEORY
Markets move between premium (expensive) and discount (cheap) zones. Smart money accumulates in discount zones and distributes in premium zones. This indicator identifies these zones automatically.
2. ADAPTIVE TREND FOLLOWING
Unlike fixed-period moving averages, the Elite Trend Engine adjusts to current market volatility, providing more accurate trend signals in both trending and ranging conditions.
3. CONFLUENCE-BASED ENTRIES
Signals only trigger when multiple conditions align:
- Price in correct zone (premium for shorts, discount for longs)
- Trend confirmation (cloud color matches direction)
- Volume validation (spike or climax present)
- Price action strength (strong rejection candles)
This multi-layer approach dramatically reduces false signals.
═══════════════════════════════════════════════════════════════
🔔 ALERT SETUP
═══════════════════════════════════════════════════════════════
This indicator includes 5 alert types:
1. Long Signal → Triggers when buy conditions met
2. Short Signal → Triggers when sell conditions met
3. Volume Climax → Warns of pot

Mean-Reversion with CooldownThis strategy requires no indicators or fundamental analysis. It is designed for longer-term positions and works especially well on unleveraged instruments with strong long-term upward trends, such as precious metals. Feel free to experiment with different timeframes — I’ve found that 1-hour charts work particularly well for cryptocurrencies.
The idea is to filter out ongoing bear phases as effectively as possible and capitalize on long-term bull runs.
The script implements an idea that came to me in a state of complete sleep deprivation: open a random long position with a fixed take-profit (TP) and a tight stop-loss (SL).
If the TP is hit — great, we simply try again.
If the SL is triggered — too bad, we pause for a while and then try again.
## Cooldown (Waiting) Mechanism
The waiting mechanism is simple: the more consecutive SL hits we get, the longer we wait before opening the next trade. The waiting time is measured in closed candles, and thus depends on the timeframe you are using.
## Two cooldown calculation modes are currently supported:
### 1. FIBONACCI
The cooldown follows the Fibonacci sequence, based on the number of consecutive losses:
1st loss → wait 1 bar
2nd loss → wait 1 bar
3rd loss → wait 2 or 3 bars (depending on definition)
4th loss → wait 3 or 5 bars
etc.
### 2. POWER OF TWO
The cooldown increases exponentially:
1st loss → wait 2 bars
2nd loss → wait 4 bars
3rd loss → wait 8 bars
4th loss → wait 16 bars
and so on, using the formula 2ⁿ.
## Configurable Parameters
### Cooldown Pause Calculation
The settings allow you to define the SL and TP as percentages of the position value.
The "Cooldown Pause Calculation" option determines how the next cooldown duration is computed after a losing trade.
The system keeps track of how many consecutive losses have occurred since the last profitable trade. That counter is then used to compute how many bars we must wait before opening the next position.
### Maximum Cooldown
The "Max Cooldown Candles" setting defines the maximum number of bars we are allowed to wait before placing a new trade. This prevents the strategy from “locking itself out” for too long and mitigates the fear of missing out (FOMO).
Once the cooldown duration reaches this maximum, the system essentially wraps around and starts the progression again. In the script, this is handled using a simple modulo operation based on the chosen maximum.

KAMA Flip strategyI built this strategy because I wanted something that doesn’t overcomplicate trading.
No 20 indicators, no guessing, no “maybe I should close here.”
Just a clear momentum flip, a defined stop, and a defined take profit. (for me on 1D BTC chart it works best with 6% stoploss and 3% takeprofit, lookback should be 40, everything else standard)
The idea is simple: when momentum shifts, I want to be on the right side of it.
KAMA is good for this because it speeds up when the market moves and slows down when it doesn’t.
I normalize it so it becomes a clean zero-line oscillator.
Above zero means momentum is turning up. Below zero means it’s turning down.
That’s the entire entry logic. A flip is a flip.
The exit logic is just as simple: one stop loss, one take profit, both fixed percentages from the entry.
The position closes 100% at the target or the stop. No scaling in, no scaling out, no trailing.
It’s straightforward and easy to analyze because every trade has the exact same structure.
I originally made this for BTC on the daily chart, but nothing stops you from trying it on other charts.
If you want it only to go long, only to go short, or take both sides, you can set that.
All the KAMA parameters are open so you can play with how reactive the signal is.
The visuals and SL/TP lines can be turned on or off depending on how clean you want your chart.
This isn’t financial advice. It’s just a system I like because it’s simple, objective, and does exactly what it’s supposed to do.
Test it, adjust it, break it, rebuild it — do whatever fits your own approach.

Third eye • StrategyThird eye • Strategy – User Guide
1. Idea & Concept
Third eye • Strategy combines three things into one system:
Ichimoku Cloud – to define market regime and support/resistance.
Moving Average (trend filter) – to trade only in the dominant direction.
CCI (Commodity Channel Index) – to generate precise entry signals on momentum breakouts.
The script is a strategy, not an indicator: it can backtest entries, exits, SL, TP and BreakEven logic automatically.
2. Indicators Used
2.1 Ichimoku
Standard Ichimoku settings (by default 9/26/52/26) are used:
Conversion Line (Tenkan-sen)
Base Line (Kijun-sen)
Leading Span A & B (Kumo Cloud)
Lagging Span is calculated but hidden from the chart (for visual simplicity).
From the cloud we derive:
kumoTop – top of the cloud under current price.
kumoBottom – bottom of the cloud under current price.
Flags:
is_above_kumo – price above the cloud.
is_below_kumo – price below the cloud.
is_in_kumo – price inside the cloud.
These conditions are used as trend / regime filters and for stop-loss & trailing stops.
2.2 Moving Average
You can optionally display and use a trend MA:
Types: SMA, EMA, DEMA, WMA
Length: configurable (default 200)
Source: default close
Filter idea:
If MA Direction Filter is ON:
When Close > MA → strategy allows only Long signals.
When Close < MA → strategy allows only Short signals.
The MA is plotted on the chart (if enabled).
2.3 CCI & Panel
The CCI (Commodity Channel Index) is used for entry timing:
CCI length and source are configurable (default length 20, source hlc3).
Two thresholds:
CCI Upper Threshold (Long) – default +100
CCI Lower Threshold (Short) – default –100
Signals:
Long signal:
CCI crosses up through the upper threshold
cci_val < upper_threshold and cci_val > upper_threshold
Short signal:
CCI crosses down through the lower threshold
cci_val > lower_threshold and cci_val < lower_threshold
There is a panel (table) in the bottom-right corner:
Shows current CCI value.
Shows filter status as colored dots:
Green = filter enabled and passed.
Red = filter enabled and blocking trades.
Gray = filter is disabled.
Filters shown in the panel:
Ichimoku Cloud filter (Long/Short)
Ichimoku Lines filter (Conversion/Base vs Cloud)
MA Direction filter
3. Filters & Trade Direction
All filters can be turned ON/OFF independently.
3.1 Ichimoku Cloud Filter
Purpose: trade only when price is clearly above or below the Kumo.
Long Cloud Filter (Use Ichimoku Cloud Filter) – when enabled:
Long trades only if close > cloud top.
Short Cloud Filter – when enabled:
Short trades only if close < cloud bottom.
If the cloud filter is disabled, this condition is ignored.
3.2 Ichimoku Lines Above/Below Cloud
Purpose: stronger trend confirmation: Ichimoku lines should also be on the “correct” side of the cloud.
Long Lines Filter:
Long allowed only if Conversion Line and Base Line are both above the cloud.
Short Lines Filter:
Short allowed only if both lines are below the cloud.
If this filter is OFF, the conditions are not checked.
3.3 MA Direction Filter
As described above:
When ON:
Close > MA → only Longs.
Close < MA → only Shorts.
4. Anti-Re-Entry Logic (Cloud Touch Reset)
The strategy uses internal flags to avoid continuous re-entries in the same direction without a reset.
Two flags:
allowLong
allowShort
After a Long entry, allowLong is set to false, allowShort to true.
After a Short entry, allowShort is set to false, allowLong to true.
Flags are reset when price touches the Kumo:
If Low goes into the cloud → allowLong = true
If High goes into the cloud → allowShort = true
If Close is inside the cloud → both allowLong and allowShort are set to true
There is a key option:
Wait Position Close Before Flag Reset
If ON: cloud touch will reset flags only when there is no open position.
If OFF: flags can be reset even while a trade is open.
This gives a kind of regime-based re-entry control: after a trend leg, you wait for a “cloud interaction” to allow new signals.
5. Risk Management
All risk management is handled inside the strategy.
5.1 Position Sizing
Order Size % of Equity – default 10%
The strategy calculates:
position_value = equity * (Order Size % / 100)
position_qty = position_value / close
So position size automatically adapts to your current equity.
5.2 Take Profit Modes
You can choose one of two TP modes:
Percent
Fibonacci
5.2.1 Percent Mode
Single Take Profit at X% from entry (default 2%).
For Long:
TP = entry_price * (1 + tp_pct / 100)
For Short:
TP = entry_price * (1 - tp_pct / 100)
One strategy.exit per side is used: "Long TP/SL" and "Short TP/SL".
5.2.2 Fibonacci Mode (2 partial TPs)
In this mode, TP levels are based on a virtual Fib-style extension between entry and stop-loss.
Inputs:
Fib TP1 Level (default 1.618)
Fib TP2 Level (default 2.5)
TP1 Share % (Fib) (default 50%)
TP2 share is automatically 100% - TP1 share.
Process for Long:
Compute a reference Stop (see SL section below) → sl_for_fib.
Compute distance: dist = entry_price - sl_for_fib.
TP levels:
TP1 = entry_price + dist * (Fib TP1 Level - 1)
TP2 = entry_price + dist * (Fib TP2 Level - 1)
For Short, the logic is mirrored.
Two exits are used:
TP1 – closes TP1 share % of position.
TP2 – closes remaining TP2 share %.
Same stop is used for both partial exits.
5.3 Stop-Loss Modes
You can choose one of three Stop Loss modes:
Stable – fixed % from entry.
Ichimoku – fixed level derived from the Kumo.
Ichimoku Trailing – dynamic SL following the cloud.
5.3.1 Stable SL
For Long:
SL = entry_price * (1 - Stable SL % / 100)
For Short:
SL = entry_price * (1 + Stable SL % / 100)
Used both for Percent TP mode and as reference for Fib TP if Kumo is not available.
5.3.2 Ichimoku SL (fixed, non-trailing)
At the time of a new trade:
For Long:
Base SL = cloud bottom minus small offset (%)
For Short:
Base SL = cloud top plus small offset (%)
The offset is configurable: Ichimoku SL Offset %.
Once computed, that SL level is fixed for this trade.
5.3.3 Ichimoku Trailing SL
Similar to Ichimoku SL, but recomputed each bar:
For Long:
SL = cloud bottom – offset
For Short:
SL = cloud top + offset
A red trailing SL line is drawn on the chart to visualize current stop level.
This trailing SL is also used as reference for BreakEven and for Fib TP distance.
6. BreakEven Logic (with BE Lines)
BreakEven is optional and supports two modes:
Percent
Fibonacci
Inputs:
Percent mode:
BE Trigger % (from entry) – move SL to BE when price goes this % in profit.
BE Offset % from entry – SL will be set to entry ± this offset.
Fibonacci mode:
BE Fib Level – Fib level at which BE will be activated (default 1.618, same style as TP).
BE Offset % from entry – how far from entry to place BE stop.
The logic:
Before BE is triggered, SL follows its normal mode (Stable/Ichimoku/Ichimoku Trailing).
When BE triggers:
For Long:
New SL = max(current SL, BE SL).
For Short:
New SL = min(current SL, BE SL).
This means BE will never loosen the stop – only tighten it.
When BE is activated, the strategy draws a violet horizontal line at the BreakEven level (once per trade).
BE state is cleared when the position is closed or when a new position is opened.
7. Entry & Exit Logic (Summary)
7.1 Long Entry
Conditions for a Long:
CCI signal:
CCI crosses up through the upper threshold.
Ichimoku Cloud Filter (optional):
If enabled → price must be above the Kumo.
Ichimoku Lines Filter (optional):
If enabled → Conversion Line and Base Line must be above the Kumo.
MA Direction Filter (optional):
If enabled → Close must be above the chosen MA.
Anti-re-entry flag:
allowLong must be true (cloud-based reset).
Position check:
Long entries are allowed when current position size ≤ 0 (so it can also reverse from short to long).
If all these conditions are true, the strategy sends:
strategy.entry("Long", strategy.long, qty = calculated_qty)
After entry:
allowLong = false
allowShort = true
7.2 Short Entry
Same structure, mirrored:
CCI signal:
CCI crosses down through the lower threshold.
Cloud filter: price must be below cloud (if enabled).
Lines filter: conversion & base must be below cloud (if enabled).
MA filter: Close must be below MA (if enabled).
allowShort must be true.
Position check: position size ≥ 0 (allows reversal from long to short).
Then:
strategy.entry("Short", strategy.short, qty = calculated_qty)
Flags update:
allowShort = false
allowLong = true
7.3 Exits
While in a position:
The strategy continuously recalculates SL (depending on chosen mode) and, in Percent mode, TP.
In Fib mode, fixed TP levels are computed at entry.
BreakEven may raise/tighten the SL if its conditions are met.
Exits are executed via strategy.exit:
Percent mode: one TP+SL exit per side.
Fib mode: two partial exits (TP1 and TP2) sharing the same SL.
At position open, the script also draws visual lines:
White line — entry price.
Green line(s) — TP level(s).
Red line — SL (if not using Ichimoku Trailing; with trailing, the red line is updated dynamically).
Maximum of 30 lines are kept to avoid clutter.
8. How to Use the Strategy
Choose market & timeframe
Works well on trending instruments. Try crypto, FX or indices on H1–H4, or intraday if you prefer more trades.
Adjust Ichimoku settings
Keep defaults (9/26/52/26) or adapt to your timeframe.
Configure Moving Average
Typical: EMA 200 as a trend filter.
Turn MA Direction Filter ON if you want to trade only with the main trend.
Set CCI thresholds
Default ±100 is classic.
Lower thresholds → more signals, higher noise.
Higher thresholds → fewer but stronger signals.
Enable/disable filters
Turn on Ichimoku Cloud and Ichimoku Lines if you want only “clean” trend trades.
Use Wait Position Close Before Flag Reset to control how often re-entries are allowed.
Choose TP & SL mode
Percent mode is simpler and easier to understand.
Fibonacci mode is more advanced: it aligns TP levels with the distance to stop, giving asymmetric RR setups (two partial TPs).
Choose Stable SL for fixed-risk trades, or Ichimoku / Ichimoku Trailing to tie stops to the cloud structure.
Set BreakEven
Enable BE if you want to lock in risk-free trades after a certain move.
Percent mode is straightforward; Fib mode keeps BreakEven in harmony with your Fib TP setup.
Run Backtest & Optimize
Press “Add to chart” → go to Strategy Tester.
Adjust parameters to your market and timeframe.
Look at equity curve, PF, drawdown, average trade, etc.
Live / Paper Trading
After you’re satisfied with backtest results, use the strategy to generate signals.
You can mirror entries/exits manually or connect them to alerts (if you build an alert-based execution layer).

Student Wyckoff Target Shooter
**Target Shooter — Equal Move Target Tool (Larry Williams idea)**
**1. What this indicator does**
Target Shooter is a tool that measures the last meaningful price swing and projects an **equal move target** in the direction of the breakout.
The logic is simple:
* The market makes a move from point A to point B (a swing high to a swing low, or vice versa).
* Then price breaks out above or below this swing range.
* Target Shooter takes the size of that swing and **adds it in the direction of the breakout**, showing a logical **price target zone** where the move may:
* slow down,
* react,
* or potentially reverse.
This is a practical implementation of the “Equal Moves” idea often referenced by Larry Williams.
---
**2. Core idea (example)**
Example from the classic explanation:
* Price drops from **80 down to 20** → the move is **60 points**.
* The swing range is now: **High = 80, Low = 20**.
* Later, price **breaks above 80**.
Target Shooter assumes:
> “If the market could move 60 points in one direction, after a breakout it may travel another 60 points in the opposite direction.”
So the upside target becomes:
* Move size: 80 − 20 = 60
* Breakout above 80
* **Target = 80 + 60 = 140**
The indicator finds such swings automatically and draws:
* **UT (Upper Target)** on upside breakouts
* **DT (Down Target)** on downside breakouts
---
**3. What you see on the chart**
1. **Target lines**
* When price breaks **above** a previous swing range, the indicator plots a horizontal **UT (Upper Target)** line — the projected equal move target.
* When price breaks **below** the previous swing range, it plots a **DT (Down Target)** line — the downside target.
* Each line is drawn from the breakout bar and extended to the right for a user-defined number of bars.
2. **Price labels**
* A small label “UT” or “DT” is shown at the end of the line with the exact target price.
* This makes it easy to see where the projected target is without checking the scale.
3. **Optional swing range (debug view)**
* There is an option to display the **swing range** that the target is based on (similar to a Donchian channel on previous bars).
* This shows the upper (swing high) and lower (swing low) boundaries the indicator used to define the last move.
---
**4. Key inputs (plain language)**
* **Swing window length (bars)**
How many bars back the indicator looks to find the last meaningful swing (highest high and lowest low).
This is like the length of a Donchian channel used to define the previous range.
Smaller values → more frequent, shorter targets.
Larger values → bigger swings and more distant targets.
* **Minimum move size (in ticks)**
This is a noise filter.
If the distance between the swing high and swing low is smaller than this threshold, no targets are drawn.
The indicator will only react to moves that are big enough to matter for your trading.
* **Breakout type: Close vs High/Low**
* **Breakout by Close**:
The target appears only when the **bar closes** above/below the swing range.
More conservative and fewer false signals.
* **Breakout by High/Low**:
The target appears as soon as the **high** or **low** of the bar breaks the swing range.
Faster and more aggressive, but more sensitive to noise.
* **Target line length (bars)**
How far to the right the UT/DT lines should be extended.
Shorter length → local target zones.
Longer length → important levels visible far into the future.
* **Appearance settings**
* Separate color, width and style for **UT** and **DT** lines.
* Option to show or hide labels with price and “UT/DT” text.
---
**5. How to use Target Shooter in trading**
> Important: this is **not** an entry signal indicator.
> Target Shooter is a **targeting and context tool**, not a standalone system.
Typical uses:
1. **Planning take-profit zones**
* You already have an entry signal from your own strategy (Wyckoff, Larry Williams patterns, levels, volume, whatever you use).
* Target Shooter shows a **logical equal move target** where the current wave can reasonably “shoot”.
* You can:
* place your main take-profit around the target,
* scale out part of the position,
* tighten stops when price approaches the target.
2. **Finding potential reaction / reversal areas**
* Equal move targets often act as **zones of interest**.
* If price reaches a UT/DT level and then shows weakness/absorption/volume spikes or reversal candles, this might be a good place to take profits or look for counter-trend opportunities (for experienced traders).
3. **Assessing trend strength**
* If price **easily exceeds** the equal move target and keeps going without any reaction, it suggests a very strong trend.
* If price **fails to reach** the target and reverses early, the move is weaker than expected.
---
**6. Timeframes**
Target Shooter can be used on:
* **Intraday** (M5, M15, M30, H1) — for shorter-term targets within the day,
* **Higher timeframes** (H4, D1 and above) — for swing and position trades.
General rule:
The **higher the timeframe and the larger the swing**, the **more important** the target level tends to be.
---
**7. Notes and limitations**
* The indicator does **not** predict the future.
It simply projects a geometric equal move from the last swing.
* It should be combined with your own trading framework:
* support/resistance,
* Wyckoff / VSA,
* trend tools,
* volume/flow, etc.
* Always keep proper risk management.
A target is a **scenario**, not a guarantee.
.

Price Channel ScalpingMy X account:@CTF_bule_lotus
1. Core Logic (Price Channel Breakout)
The strategy relies on a single, simple indicator: the highest high of the past 20 bars.
When the current price breaks above this 20-period high, a stop entry is used to initiate a long position.
This design avoids prediction.
The model waits for the market to demonstrate momentum before participating.
2. Trade Direction (Long Only)
The strategy exclusively trades long positions and does not take shorts.
This choice is based on:
ETH’s historically upward-biased structure
Avoiding noise from two-sided signals during high-volatility periods
Keeping the direction consistent, which is beneficial for scalping-style systems
3. Risk Management (Fixed TP / SL)
Immediately after entry, the strategy sets two fixed exit conditions:
Take Profit: +10 price units
Stop Loss: –10 price units
Both are automatically converted using the market’s minimum tick size to ensure cross-instrument applicability.
This fixed TP/SL structure is typical in scalping systems:
small wins, fast exits, controlled losses, high turnover.
4. Transaction Costs
A 0.03% fee is applied to every trade throughout the entire backtest.
This fee level reflects the cost structure of major centralized exchanges, making results closer to real-world conditions.
5. Data & Time Range (2016–2025 Full Sample)
The backtest uses ETH’s complete historical dataset from 2016 to 2025.
No subjective filtering is applied—large moves, flash crashes, and black-swan events are all included.
The strategy does not rely on heavy parameter tuning, reducing the risk of overfitting.
6. Backtest Results (Including Fees)
Under this fixed, rule-based structure, the cumulative return is:
1,202,002.77% (2016 → 2025)
Even after including transaction fees, performance is driven by:
High trade frequency and small profit targets
Strict loss containment
Capturing momentum during breakout regimes
7. Transparency & Reproducibility
I will publish the full Pine Script implementation, including:
Entry logic
Exit logic
Fee configuration
All parameters
Backtesting framework
Transparency and reproducibility remain the core principles of this research.

Session Open Range, Breakout & Trap Framework - TrendPredator OBSession Open Range, Breakout & Trap Framework — TrendPredator Open Box
Stacey Burke’s trading approach combines concepts from George Douglas Taylor, Tony Crabel, Steve Mauro, and Robert Schabacker. His framework focuses on reading price behaviour across daily templates and identifying how markets move through recurring cycles of expansion, contraction, and reversal. While effective, much of this analysis requires real-time interpretation of session-based behaviour, which can be demanding for traders working on lower intraday timeframes.
The TrendPredator indicators formalize parts of this methodology by introducing mechanical rules for multi-timeframe bias tracking and session structure analysis. They aim to present the key elements of the system—bias, breakouts, fakeouts, and range behaviour—in a consistent and objective way that reduces discretionary interpretation.
The Open Box indicator focuses specifically on the opening behaviour of major trading sessions. It builds on principles found in classical Open Range Breakout (ORB) techniques described by Tony Crabel, where a defined time window around the session open forms a structural reference range. Price behaviour relative to this range—breaking out, failing back inside, or expanding—can highlight developing session bias, potential trap formation, and directional conviction.
This indicator applies these concepts throughout the major equity sessions. It automatically maps the session’s initial range (“Open Box”) and tracks how price interacts with it as liquidity and volatility increase. It also incorporates related structural references such as:
* the first-hour high and low of the futures session
* the exact session open level
* an anchored VWAP starting at the session open
* automated expansion levels projected from the Open Box
In combination, these components provide a unified view of early session activity, including breakout attempts, fakeouts, VWAP reactions, and liquidity targeting. The Open Box offers a structured lens for observing how price transitions through the major sessions (Asia → London → New York) and how these behaviours relate to higher-timeframe bias defined in the broader TrendPredator framework.
Core Features
Open Box (Session Structure)
The indicator defines an initial session range beginning at the selected session open. This “Open Box” represents a fixed time window—commonly the first 30 minutes, or any user-defined duration—that serves as a structural reference for analysing early session behaviour.
The range highlights whether price remains inside the box, breaks out, or rejects the boundaries, providing a consistent foundation for interpreting early directional tendencies and recognising breakout, continuation, or fakeout characteristics.
How it works:
* At the session open, the indicator calculates the high and low over the specified time window.
* This range is plotted as the initial structure of the session.
* Price behaviour at the boundaries can illustrate emerging bias or potential trap formation.
* An optional secondary range (e.g., 15-minute high/low) can be enabled to capture early volatility with additional precision.
Inputs / Options:
* Session specifications (Tokyo, London, New York)
* Open Box start and end times (e.g., equity open + first 30 minutes, or any custom length)
* Open Box colour and label settings
* Formatting options for Open Box high and low lines
* Optional secondary range per session (e.g., 15-minute high/low)
* Forward extension of Open Box high/low lines
* Number of historic Open Boxes to display
Session VWAPs
The indicator plots VWAPs for each major trading session—Asia, London, and New York—anchored to their respective session opens. These session-specific VWAPs assist in tracking how value develops through the day and how price interacts with session-based volume distributions.
How it works:
* At each session open, a VWAP is anchored to the open price.
* The VWAP updates throughout the session as new volume and price data arrive.
* Deviations above or below the VWAP may indicate balance, imbalance, or directional control.
* Viewed together, session VWAPs help identify transitions in value across sessions.
Inputs / Options:
* Enable or disable VWAP per session
* Adjustable anchor and end times (optionally to end of day)
* Line styling and label settings
* Number of historic VWAPs to draw
First Hour High/Low Extensions
The indicator marks the high and low formed during the first hour of each session. These reference points often function as early control levels and provide context for assessing whether the session is establishing bias, consolidating, or exhibiting reversal behaviour.
How it works:
* After the session starts, the indicator records the highest and lowest prices during the first hour.
* These levels are plotted and extended across the session.
* They provide a visual reference for observing reactions, targets, or rejection zones.
Inputs / Options:
* Enable or disable for each session
* Line style, colour, and label visibility
* Number of historic sessions displayed
EQO Levels (Equity Open)
The indicator plots the opening price of each configured session. These “Equity Open” levels represent short-term reference points that can attract price early in the session.
Once the level is revisited after the Open Box has formed, it is automatically cut to avoid clutter. If not revisited, the line remains as an untested reference, similar to a naked point of control.
How it works:
* At session open, the open price is recorded.
* The level is plotted as a local reference.
* If price interacts with the level after the Open Box completes, the line is cut.
* Untested EQOs extend forward until interacted with.
Inputs / Options:
* Enable/disable per session
* Line style and label settings
* Optional extension into the next day
* Option for cutting vs. hiding on revisit
* Number of historic sessions displayed
OB Range Expansions (Automatic)
Range expansions are calculated from the height of the Open Box. These levels provide structured reference zones for identifying potential continuation or exhaustion areas within a session.
How it works:
* After the Open Box is formed, multiples of the range (e.g., 1×, 2×, 3×) are projected.
* These expansion levels are plotted above and below the range.
* Price reactions near these areas can illustrate continuation, hesitation, or potential reversal.
Inputs / Options:
* Enable or disable per session
* Select number of multiples
* Line style, colour, and label settings
* Extension length into the session
Stacey Burke 12-Candle Window Marker
The indicator can highlight the 12-candle window often referenced in Stacey Burke’s session methodology. This window represents the key active period of each session where breakout attempts, volatility shifts, and reversal signatures often occur.
How it works:
* A configurable window (default 12 candles) is highlighted from each session open.
* This window acts as a guide for observing active session behaviour.
* It remains visible throughout the session for structural context.
Inputs / Options:
* Enable/disable per session
* Configurable window duration (default: 3 hours)
* Colour and transparency controls
Concept and Integration
The Open Box is built around the same multi-timeframe logic that underpins the broader TrendPredator framework.
While higher-timeframe tools track bias and setups across the H8–D–W–M levels, the Open Box focuses on the H1–M30 domain to define session structure and observe how early intraday behaviour aligns with higher-timeframe conditions.
The indicator integrates with the TrendPredator FO (Breakout, Fakeout & Trend Switch Detector), which highlights microstructure signals on lower timeframes (M15/M5). Together they form a layered workflow:
* Higher timeframes: context, bias, and developing setups
* TrendPredator OB: intraday and intra-session structure
* TrendPredator FO: microstructure confirmation (e.g., FOL/FOH, switches)
This alignment provides a structured way to observe how daily directional context interacts with intraday behaviour.
See the public open source indicator TP FO here (click on it for access):
Practical Application
Before Session Open
* Review previous session Open Box, Open level, and VWAPs
* Assess how higher-timeframe bias aligns with potential intraday continuation or reversal
* Note untested EQO levels or VWAPs that may function as liquidity attractors
During Session Open
* Observe behaviour around the first-hour high/low and higher-timeframe reference levels
* Monitor how the M15 and 30-minute ranges close
* Track reactions relative to the session open level and the session VWAP
After the Open Box completes
* Assess price interaction with Open Box boundaries and first-hour levels
* Use microstructure signals (e.g., FOH/FOL, switches) for potential confirmation
* Refer to expansion levels as reference zones for management or target setting
After Session
* Review how price behaved relative to the Open Box, EQO levels, VWAPs, and expansion zones
* Analyse breakout attempts, fakeouts, and whether intraday structure aligned with the broader daily move
Example Workflow and Trade
1. Higher-timeframe analysis signals a Daily Fakeout Low Continuation (bullish context).
2. The New York session forms an Open Box; price breaks above and holds above the first-hour high.
3. A Fakeout Low + Switch Bar appears on M5 (via FO), after retesting the session VWAP triggering the entry.
4. 1x expansion level serves as reference targets for take profit.
Relation to the TrendPredator Ecosystem
The Open Box is part of the TrendPredator Indicator Family, designed to apply multi-timeframe logic consistently across:
* higher-timeframe context and setups
* intraday and session structure (OB)
* microstructure confirmation (FO)
Together, these modules offer a unified structure for analysing how daily and intraday cycles interact.
Disclaimer
This indicator is for educational purposes only and does not guarantee profits.
It does not provide buy or sell signals but highlights structural and behavioural areas for analysis.
Users are solely responsible for their trading decisions and outcomes.

Consolidation Breakout PRO — Clean Boxes + 200 EMA Trend Filter High-probability range breakout detector that draws perfect, always-visible consolidation boxes and only alerts when price breaks out with strong volume and (optionally) in the direction of the prevailing trend.
Features
Automatically draws and extends clean consolidation boxes in real time
Boxes stop extending the moment the breakout occurs — no more “ghost” lines
Optional but powerful 200 EMA trend filter (dramatically reduces false breakouts)
Stronger volume confirmation (default 1.8× the 20-period average, fully adjustable)
Auto-deletes old boxes so your chart stays perfectly clean even after hundreds of signals
Clear “BREAKOUT ↑” and “BREAKDOWN ↓” labels + ready-to-use alerts
Works on any market and any timeframe (best on 1H, 4H, Daily)
How to trade it (edge > 65 % when used correctly)
Wait for the labeled breakout candle to close
Enter on pullback/retest of the box edge (or on strong close + retest)
Stop-loss just outside the opposite side of the box
Take-profit: minimum 1:2, ideally measured move (box height added/subtracted) or trailing with the 20 EMA
This is the cleanest and most professional public consolidation breakout tool available in 2025 — no repainting, no lag, no chart clutter.
Created and continuously improved with love for the TradingView community.

Advanced Trading System - Volume Profile + BB + RSI + FVG + FibAdvanced Multi-Indicator Trading System with Volume Profile, Bollinger Bands, RSI, FVG & Fibonacci
Overview
This comprehensive trading indicator combines five powerful technical analysis tools into one unified system, designed to identify high-probability trading opportunities with precision entry and exit signals. The indicator integrates Volume Profile analysis, Bollinger Bands, RSI momentum, Fair Value Gaps (FVG), and Fibonacci retracement levels to provide traders with a complete market analysis framework.
Key Features
1. Volume Profile & Point of Control (POC)
Automatically calculates the Point of Control - the price level with the highest trading volume
Identifies Value Area High (VAH) and Value Area Low (VAL)
Updates dynamically based on customizable lookback periods
Helps identify key support and resistance zones where institutional traders are active
2. Bollinger Bands Integration
Standard 20-period Bollinger Bands with customizable multiplier
Identifies overbought and oversold conditions
Measures market volatility through band width
Signals generated when price approaches extreme levels
3. RSI Momentum Analysis
14-period Relative Strength Index with visual background coloring
Overbought (70) and oversold (30) threshold alerts
Integrated into buy/sell signal logic for confirmation
Real-time momentum tracking in info dashboard
4. Fair Value Gap (FVG) Detection
Automatically identifies bullish and bearish fair value gaps
Visual representation with colored boxes
Highlights imbalance zones where price may return
Used for high-probability entry confirmation
5. Fibonacci Retracement Levels
Auto-calculated based on recent swing high/low
Key levels: 23.6%, 38.2%, 50%, 61.8%, 78.6%
Perfect for identifying profit-taking zones
Dynamic lines that update with market movement
6. Smart Signal Generation
The indicator generates BUY and SELL signals based on multi-condition confluence:
BUY Signal Requirements:
Price near lower Bollinger Band
RSI in oversold territory (< 30)
High volume confirmation (optional)
Bullish FVG or POC alignment
SELL Signal Requirements:
Price near upper Bollinger Band
RSI in overbought territory (> 70)
High volume confirmation (optional)
Bearish FVG or POC alignment
7. Automated Take Profit Levels
Three dynamic profit targets: 1%, 2%, and 3%
Automatically calculated from entry price
Visual markers on chart
Individual alerts for each level
8. Comprehensive Alert System
The indicator includes 10+ alert types:
Buy signal alerts
Sell signal alerts
Take profit level alerts (TP1, TP2, TP3)
Fibonacci level cross alerts
RSI overbought/oversold alerts
Bullish/Bearish FVG detection alerts
9. Real-Time Info Dashboard
Live display of all key metrics
Color-coded for quick visual analysis
Shows RSI, BB Width, Volume ratio, POC, Fib levels
Current signal status (BUY/SELL/WAIT)
How to Use
Setup
Add the indicator to your chart
Adjust parameters based on your trading style and timeframe
Set up alerts by clicking "Create Alert" and selecting desired conditions
Recommended Timeframes
Scalping: 5m - 15m
Day Trading: 15m - 1H
Swing Trading: 4H - Daily
Parameter Customization
Volume Profile Settings:
Length: 100 (adjust for more/less historical data)
Rows: 24 (granularity of volume distribution)
Bollinger Bands:
Length: 20 (standard period)
Multiplier: 2.0 (adjust for tighter/wider bands)
RSI Settings:
Length: 14 (standard momentum period)
Overbought: 70
Oversold: 30
Fibonacci:
Lookback: 50 (swing high/low detection period)
Signal Settings:
Volume Filter: Enable/disable volume confirmation
Volume MA Length: 20 (for volume comparison)
Trading Strategy Examples
Strategy 1: Trend Reversal
Wait for BUY signal at lower Bollinger Band
Confirm with bullish FVG or POC support
Enter position
Take partial profits at Fib 38.2% and 50%
Exit remaining position at TP3 or SELL signal
Strategy 2: Breakout Confirmation
Monitor price approaching POC level
Wait for volume spike
Enter on signal confirmation with FVG alignment
Use Fibonacci levels for scaling out
Strategy 3: Range Trading
Identify POC as range midpoint
Buy at lower BB with oversold RSI
Sell at upper BB with overbought RSI
Use FVG zones for additional confirmation
Best Practices
✅ Do:
Use multiple timeframe analysis
Combine with price action analysis
Set stop losses below/above recent swing points
Scale out at Fibonacci levels
Wait for volume confirmation on signals
❌ Don't:
Trade every signal blindly
Ignore overall market context
Use on extremely low timeframes without testing
Neglect risk management
Trade during low liquidity periods
Risk Management
Always use stop losses
Risk no more than 1-2% per trade
Consider market conditions and volatility
Scale position sizes based on signal strength
Use the volume filter for additional confirmation
Technical Specifications
Pine Script Version: 6
Overlay: Yes (displays on main chart)
Max Boxes: 500 (for FVG visualization)
Max Lines: 500 (for Fibonacci levels)
Alerts: 10+ customizable conditions
Performance Notes
This indicator works best in:
Trending markets with clear momentum
High-volume trading sessions
Assets with good liquidity
When multiple signals align
Less effective in:
Extremely choppy/sideways markets
Low-volume periods
During major news events (high volatility)
Updates & Support
This indicator is actively maintained and updated. Future enhancements may include:
Additional volume profile features
More sophisticated FVG tracking
Enhanced alert customization
Backtesting integration
Disclaimer
This indicator is for educational and informational purposes only. It does not constitute financial advice. Past performance does not guarantee future results. Always conduct your own research and consider consulting with a financial advisor before making trading decisions. Trading involves substantial risk of loss.

Low Volatility Breakout + TP/SL Levels█ OVERVIEW
"Low Volatility Breakout + TP/SL Levels" is a breakout indicator designed to detect and trade breakouts from periods of low volatility (consolidation). Unlike classic strategies based on fixed support/resistance levels, this indicator dynamically identifies consolidations characterized by small candle bodies and only generates a signal when the breakout occurs with a large, decisive candle. It also automatically plots 3 Take Profit levels and a Stop Loss (with two calculation modes), making it a complete breakout trading tool.
█ CONCEPTS
The strongest market moves most often start after a prolonged period of very low volatility — when candles become small and the market "falls asleep". The indicator first detects such consolidations (small bodies for at least X bars), draws a box around them, and then waits for a breakout with a candle significantly larger than the average. Additional filters (e.g., the box height cannot exceed the average candle body by too much) eliminate false consolidations and volatility traps. Immediately after the breakout, TP1, TP2, TP3, and SL levels are plotted.
█ FEATURES
Dynamic detection of low-volatility consolidations
- candles with small bodies (< average body × consolidationMultiplier)
- minimum number of bars in consolidation: confirmBars (default 5)
Automatic drawing of consolidation boxes
- green (bullish) or red (bearish) with transparent background (85)
- adjustable border thickness (border_width 1–5)
- box height filter (boxHeightMultiplier, default 6.0 × average body) – removes overly stretched/false consolidations
Breakout conditions
- current candle must be larger than average body × threshold (default 1.5)
- must be the largest candle in the entire consolidation
- must close above the highest high (long) or below the lowest low (short)
Breakout signals
- small green triangles below the bar (long)
- small red triangles above the bar (short)
Automatic Take Profit and Stop Loss levels (drawn 5 bars forward)
- two calculation modes:
• Candle Multiplier – based on average true range (high-low) over tp_sl_length period
• Percentage – fixed percentage from breakout close price (percentages must be manually adjusted to the asset and timeframe)
- 3 TP levels (default 2×, 3×, 4× or 2%, 3%, 4%)
- 1 SL level (default 2× or 1.5%)
Live TP/SL price table (top-right corner)
- displays exact current values of SL, TP1, TP2, TP3 immediately after each new signal
- colors identical to drawn lines (red background for SL, green for TP levels)
- updates automatically with every new breakout
Built-in alerts
- “Bullish Breakout Alert” and “Bearish Breakout Alert”
█ HOW TO USE
Add the indicator to your TradingView chart → Indicators → search “Low Volatility Breakout + TP/SL Levels”.
After each valid breakout you will immediately see:
- the colored box
- signal triangle
- horizontal TP/SL lines
- updated table in the top-right corner showing precise price levels for the current trade
Key settings to adjust:
Consolidation Settings
- Volatility Window (length) – period for average body calculation (default 20)
- Consolidation Multiplier – how small bodies must be to count as consolidation (default 2.0)
- Breakout Multiplier – minimum size of breakout candle (default 1.5)
- Box Height Multiplier – maximum allowed box height (default 6.0)
- Min Consolidation Bars – minimum bars required (default 5)
Risk Management Settings
- Choose TP/SL mode: Candle Multiplier or Percentage
- Adjust TP1–3 and SL multipliers/percentages to match your risk management style
Signal interpretation:
- Green triangle below bar + green box + green TP levels in table = long signal
- Red triangle above bar + red box + red SL level in table = short signal
- Boxes remain on chart until broken — they highlight accumulation/distribution zones
█ APPLICATIONS
- Trading breakouts from consolidation on all markets and timeframes
- Recommended to trade in the direction of the higher-timeframe trend or with additional confirmations (e.g., key level breaks). Aggressive mode (trading both directions) is also possible — provided box and TP/SL settings are properly optimized
- Experiment with different TP/SL ratios — higher reward-to-risk setups (e.g., SL 1×, TP3 6–8×) with lower win rate are often more profitable in the long run
- Strongly encourage testing various box parameters (consolidationMultiplier, boxHeightMultiplier, confirmBars) — small changes can dramatically affect signal frequency and quality
█ NOTES
Always test and optimize parameters for the specific instrument and timeframe.

Simple Grid Trading v1.0 [PUCHON]Simple Grid Trading v1.0
Overview
This is a Long-Only Grid Trading Strategy developed in Pine Script v6 for TradingView. It is designed to profit from market volatility by placing a series of Buy Limit orders at predefined price levels. As the price drops, the strategy accumulates positions. As the price rises, it sells these positions at a profit.
Features
Grid Types : Supports both Arithmetic (equal price spacing) and Geometric (equal percentage spacing) grids.
Flexible Order Management : Uses strategy.order for precise control and prevents duplicate orders at the same level.
Performance Dashboard : A real-time table displaying key metrics like Capital, Cashflow, and Drawdown.
Advanced Metrics : Includes Max Drawdown (MaxDD) , Avg Monthly Return , and CAGR calculations.
Customizable : Fully adjustable price range, grid lines, and lot size.
Dashboard Metrics
The dashboard (default: Bottom Right) provides a quick snapshot of the strategy's performance:
Initial Capital : The starting capital defined in the strategy settings.
Lot Size : The fixed quantity of assets purchased per grid level.
Avg. Profit per Grid : The average realized profit for each closed trade.
Cashflow : The total realized net profit (closed trades only).
MaxDD : Maximum Drawdown . The largest percentage drop in equity (realized + unrealized) from a peak.
Avg Monthly Return : The average percentage return generated per month.
CAGR : Compound Annual Growth Rate . The mean annual growth rate of the investment over the specified time period.
Strategy Settings (Inputs)
Grid Settings
Upper Price : The highest price level for the grid.
Lower Price : The lowest price level for the grid.
Number of Grid Lines : The total number of levels (lines) in the grid.
Grid Type :
Arithmetic: Distance between lines is fixed in price terms (e.g., $10, $20, $30).
Geometric: Distance between lines is fixed in percentage terms (e.g., 1%, 2%, 3%).
Lot Size : The fixed amount of the asset to buy at each level.
Dashboard Settings
Show Dashboard : Toggle to hide/show the performance table.
Position : Choose where the dashboard appears on the chart (e.g., Bottom Right, Top Left).
How It Works
Initialization : On the first bar, the script calculates the price levels based on your Upper/Lower price and Grid Type.
Entry Logic :
The strategy places Buy Limit orders at every grid level below the current price.
It checks if a position already exists at a specific level to avoid "stacking" multiple orders on the same line.
Exit Logic :
For every Buy order, a corresponding Sell Limit (Take Profit) order is placed at the next higher grid level.
MaxDD Calculation :
The script continuously tracks the highest equity peak.
It calculates the drawdown on every bar (including intra-bar movements) to ensure accuracy.
Displayed as a percentage (e.g., 5.25%).
Disclaimer
This script is for educational and backtesting purposes only. Grid trading involves significant risk, especially in strong trending markets where the price may move outside your grid range. Always use proper risk management.
